First you should read this.
You can access performance monitor by doing any of the following
- typing ‘perfmon’ in command prompt
- Go to Start -> Run and type perfmon
- selecting the Performance or Reliability and Performance Monitor (in Windows Vista® and Windows Server® 2008) from the Administrative Tools menu

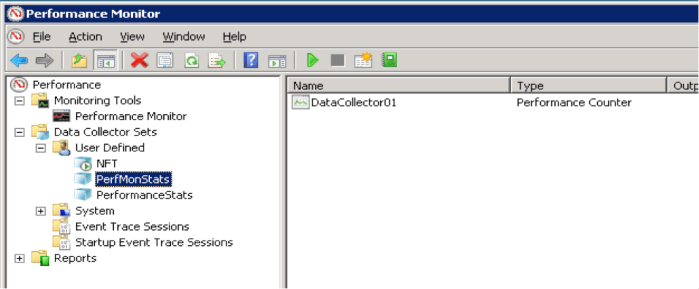
Expand Performance tree on the left hand side to reach to User Defined. This is where you will find all custom created data collector sets. As you can see, I already have two there (NFT and PerformanceStats). Lets create another one.
Right click on User Defined and select New -> Data Collector Set from the pop up menu.

In the Create New Data Collector Set dialog, provide a name to the data collector set and select Create Manually (Advanced). We will see how to create the data collector set from template later in the post.

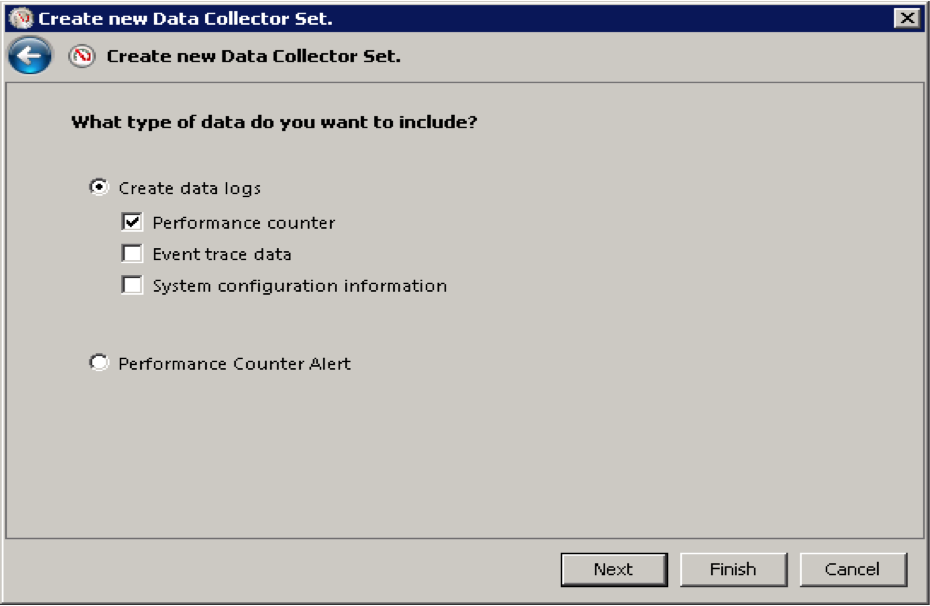
Choose Create data logs, check Performance Counter and click next
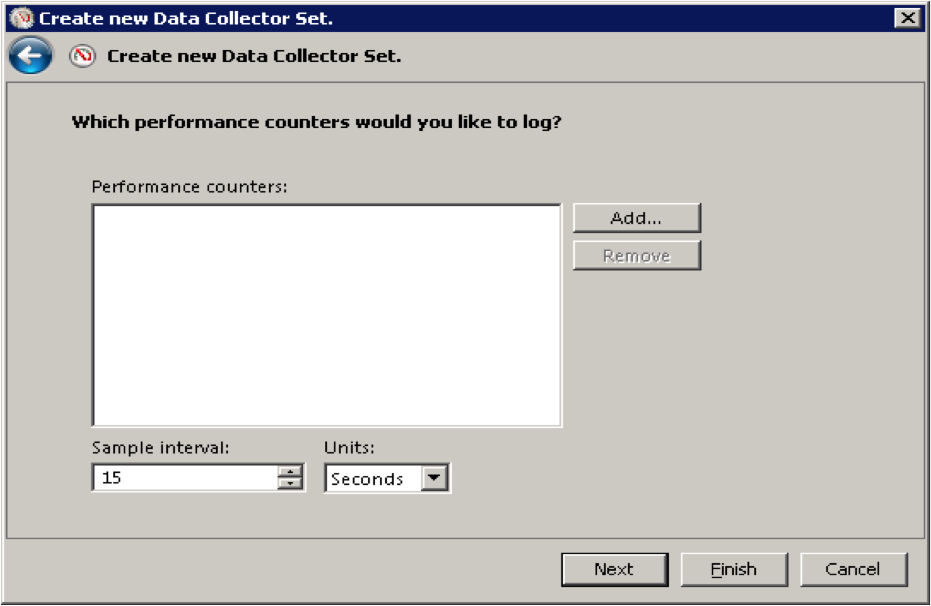
Time to add counters that we want to monitor. Before we do that, notice sample interval is set to 15 seconds. This means, a sample of counter data will be logged every 15 seconds. Select a smaller interval if collecting small dataset or bigger interval if collecting for larger data set. Lets keep it same. click Add
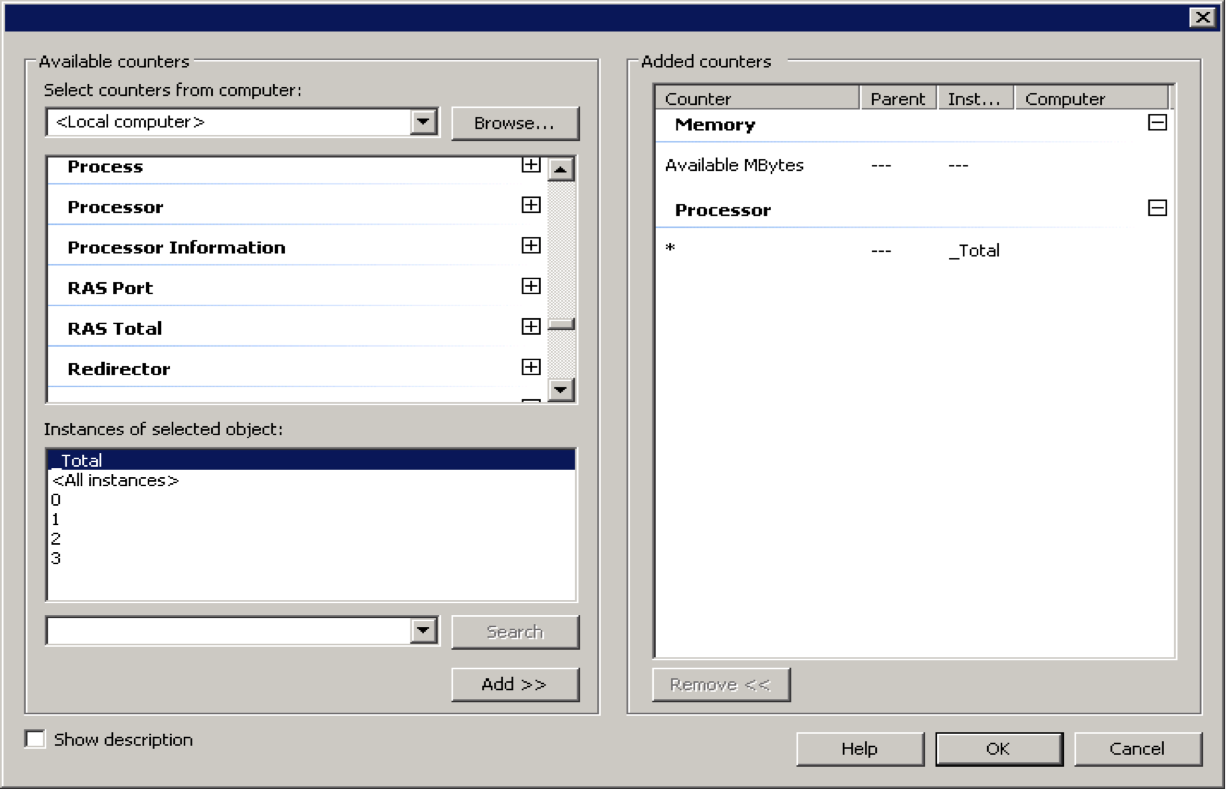
Counters are grouped into Objects. Either you can monitor the whole object or selected instances from the object. Lets say we want to monitor Available memory and CPU utilisation for local computer (i.e. the computer where you opened perfmon). First, expand Memory object, then select Available MBytes from the instances of selected object and click Add. Do similar for Processor Object, choose _Total from Instances and click Add. Click OK.
Provide path where you want to save the data and click Next.

Select Save and Close; click Finish.
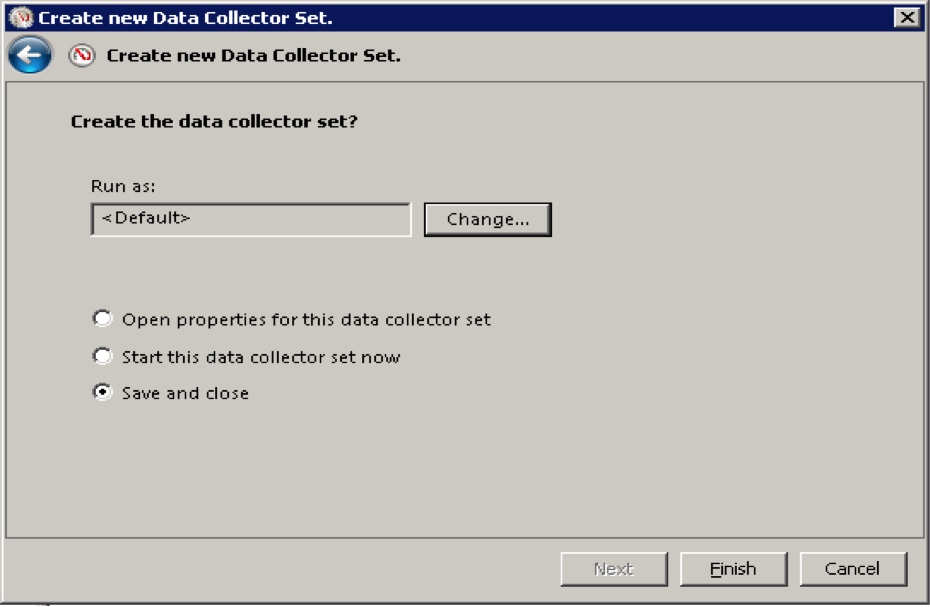
Done. We have created our own data collector set.

Nice bllog post
LikeLike